
Global LNG Trade Hit Record As Australia Top Exports
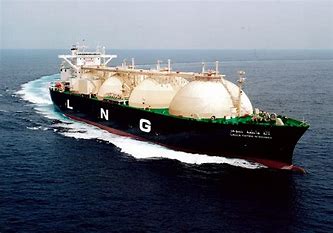
Global LNG trade occurred at record volumes for the fifth consecutive year, reaching 316.6 million tonnes, according to the International Gas Union’s (IGU) 2019 World LNG Report.
This marks an increase of 28.2 million tonnes (9.8%), from 2017, the third-largest annual increase ever behind only 2010 and 2017.
More than 99 million tonnes occurred as non-long-term trade, a 14.5 million-tonne increase from 2017 and 31% of total 2018 LNG trade. This is the second year in a row in which the non-long-term market substantially expanded due to growing LNG supply and demand elasticity. Increases in LNG supply came from higher production at new liquefaction plants.
The single greatest increase in LNG exports occurred in Australia (up 12.2 million tonnes), owing to new trains coming onstream and higher utilization at existing plants. Other significant contributors to LNG supply were the US and Russia, which added 8.2 million and 7.8 million tonnes respectively, across new and existing trains.
The Asia-Pacific region continues to be the leading LNG-exporting region, supplying 38.4% of total exports (121.6 million tonnes), consistent with its share of global exports since 2016.
Increasing demand in 2018 also played a key role in growing global LNG trade. The additions of Bangladesh and Panama as the two newest importing markets in the last year brought the total number to 37. Asia remained the driver of international LNG demand growth. China and South Korea returned as the key sources of LNG import demand in 2018, with growth of 15.8 million and 6.4 million tonnes, respectively. Together, the two countries accounted for nearly 80% of net trade’s increase.
Other key markets that drove global LNG growth included India and Pakistan, while European LNG imports increased year-on-year for the fourth consecutive year, growing 3.4 million tonnes. This increase occurred despite net negative incremental growth in these markets through the first three quarters of 2018, with the fourth quarter of the year making up for the losses.
Between January 2018 and February 2019, 36.2 million tonnes of additional liquefaction capacity entered the market, boosting global nominal capacity to a total 393 million tonnes/year. This growth in liquefaction capacity is expected to continue, with 101.3 million tpy under construction or sanctioned as of February 2019.
The 101.3 million tpy under construction or sanctioned is followed by 844.8 million tpy of proposed new capacity, much of which is aiming to reach commercial operation by the mid-2020s to meet anticipated demand, according to IGU. North America is the source of most proposed pre-final investment decision (FID) capacity (571.6 million tpy) with 293.1 million tpy on the US Gulf of Mexico coast.
US Gulf Coast projects include a cost advantage over greenfield British Columbia projects which require lengthy pipeline infrastructure to move gas from the Western Canadian Sedimentary Basin to export plants, IGU said. As a result, some projects in Canada have been unable to secure customers.
In another development, Qatar Petroleum is advancing it’s LNG expansion and will solicit tenders for EPC of onshore facilities later this month, according to a project report by Saad Sherida Al-Kaabi, minister of state for energy affairs and QP president and chief executive officer.
Al-Kaabi told the International Conference & Exhibition on Liquefied National Gas in Shanghai on Apr. 2 that Chiyoda Corp. would complete front-end engineering and design of onshore facilities “in the next few days.”
QP is expanding liquefaction capacity at Ras Laffan Industrial City to 110 million tonnes/year from 77 million tpy through the addition of four trains with capacities of 8 million tpy each.
Source: OGJ
Subscribe To Newsletter